Cards Outran Stocks on the Way Up. Are They Following Them Down?
The Year So Far
The CC2 Composite, our index of the card market, is up 56% since Jan 1. Over the same stretch the S&P 500 is up 10%, the Nasdaq 8% and the Russell 2000, the index of smaller companies, 12%. The speculative end of the market did worse: ARK Innovation (ARKK), the best-known fund of high-growth tech stocks, is down 3%, and Bitcoin is down 25%.
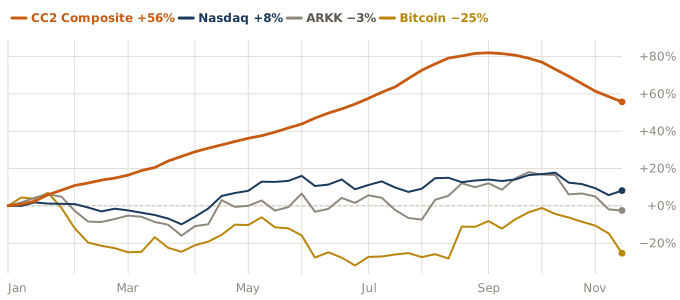
That is about 5 times the S&P's gain. In late March the S&P was down 7% for the year while the Composite was up 27%. Week to week, the card market's moves had almost nothing to do with the stock market's. Across 46 weeks, the correlation between the Composite and the S&P, the Nasdaq, ARKK or Bitcoin is close to zero, whether we compare the same week or let cards trail by up to 6 weeks.
For most of 2026, cards did not trade like a risk asset. The first half makes the case: Bitcoin fell from about $94,000 to under $60,000 and ARKK lost a fifth of its January value, while the Composite rose every month.
Then the Fall
Since the Composite's peak, the picture has changed. Its weekly moves have lined up with the Nasdaq, ARKK and Bitcoin, a correlation of about 0.4, against about 0.1 with the S&P. That rests on 10 weeks, and the figure moves a lot depending on which week you start counting, so it is too thin to call a lasting link. But it is the first stretch this year in which cards moved with the speculative end of the market. The Composite entered correction territory, 10% or more below its high, on Nov 2. The Nasdaq briefly joined it in early November.
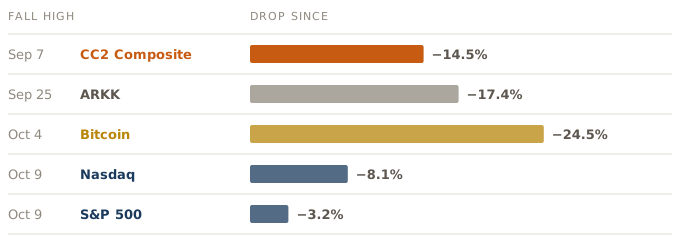
The order of the highs matters more, and cards turned first. The Composite peaked in the first week of September. ARKK peaked 3 weeks later, Bitcoin 4 weeks later and the S&P and Nasdaq 5 weeks later. The Composite uses 4-week median prices, which trail actual sales by a week or two, so the real top in card prices likely came earlier still.
Whatever pulled the card market down this fall, it was not a stock-market sell-off that cards followed.
What to Watch: 2 Outcomes
- If stocks recover and cards keep sliding, the fall's link was a coincidence and the card market's decline has its own causes.
- If cards and speculative stocks bounce together, the card market may have started trading as one more bet on risk, and the next tech sell-off would matter for card prices in a way it did not this spring.
We'll track it in the weekly Composite note.
How we got these numbers: the CC2 Composite from CardHedger sales through the Nov 16 close. Stock, fund and Bitcoin prices are weekly closes from Yahoo Finance through Nov 13 (Bitcoin through Nov 15). Each Friday market close is compared with the following Monday's Composite close, which reflects card sales through the weekend. Changes for the year run from each market's Dec 31 close. Correlations use weekly percentage changes. Fall highs are the highest weekly close since July. This is 1 year and 1 sell-off; treat the fall link as an observation, not a rule.
Latest from the Calculus
All of the Calculus →
November Premier Follows the Card Market Down to $39.3M as Flipped Cards Bring a Median 16% Less
November 20 auction · 604 lots
Still Climbing? 5 Players Whose Cards Haven't Stopped
November 18, 2026CC2 Composite falls 1.8%, its tenth straight weekly decline
November 16, 2026